
Bookmap Review 2026: The Heatmap That Changed Order Flow Trading
Date: Friday, July 3, 2026
Bookmap pioneered the liquidity heatmap. It holds a 4.5 Trustpilot score from 596 reviews. Here's what it does better than anything else, the honest add-on pricing caveat, and who it's actually for. Trading involves risk of loss.
Bookmap Invented the Order Flow Heatmap. Here's the Honest Case for Using It in 2026.
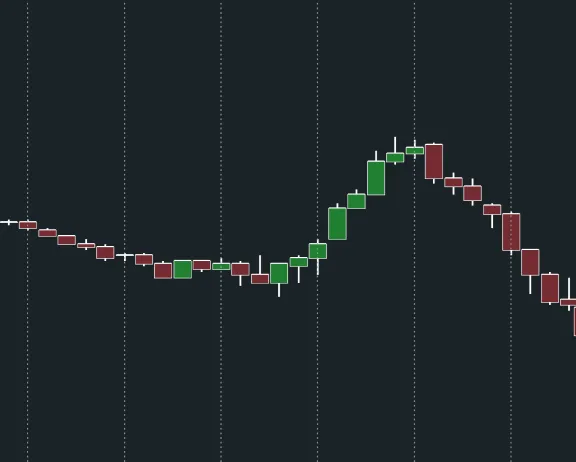
You've been trading futures with a standard DOM and candlestick chart. You're getting the outcomes but you feel like you're missing something. You keep losing entries by a few ticks. You know the big players are moving price somewhere but you can't see where until after it's already happened.
That exact problem is what Bookmap was built to solve. And it did it before anyone else figured out it was a problem.
Trading involves significant risk of loss. This content is educational only and not investment advice.
What Bookmap Actually Invented
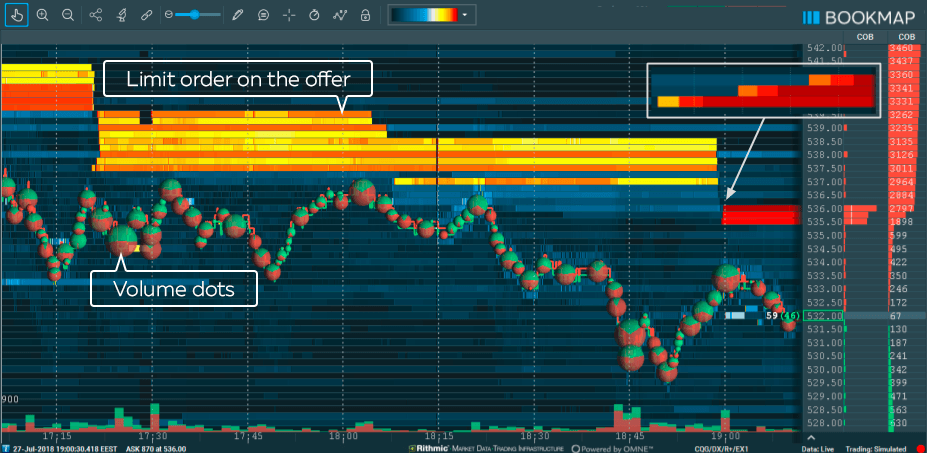
In the early 2010s, institutional traders had access to real-time order book data that most retail traders couldn't interpret quickly enough to use. You could see the DOM, but by the time you read it, it had already changed. Bookmap solved this by turning the order book into a visual heatmap plotted over time. The X-axis is time. The Y-axis is price. And the color intensity at every point shows how many limit orders are resting at that price level at that moment.
The result is something that looks like a weather radar for the market. Bright yellow and white zones indicate where large clusters of limit orders are sitting. Dark blue areas show thin liquidity. And as time moves forward, you can watch liquidity build, pull, absorb, or fake out in real time, at 40 frames per second.
This isn't a lagging indicator. It's not derived from price. It's the actual order book rendered visually. You're seeing the same data institutional algorithms are processing, just displayed in a way human eyes can interpret during a live session.
No other platform offered this when Bookmap launched. The heatmap visualization they pioneered is now considered standard in the order flow category, and every competing platform in 2026 benchmarks itself against what Bookmap built.
What Happens When a Trade Executes
Every executed trade appears on the Bookmap chart as a circle, called a Volume Dot, sized proportionally to the trade volume. The color tells you whether it was an aggressive buy (market order hitting the ask) or aggressive sell (market order hitting the bid). You're watching the interaction between resting limit orders and the aggressive market orders that move price, in real time, plotted directly on the same chart as the heatmap.
This combination, resting liquidity plus aggressive volume, shows you things standard charts simply cannot. You can watch a large limit order absorb buying pressure repeatedly, indicating a seller defending that level. You can see a cluster of orders pull moments before a breakout, suggesting the support was manufactured. You can identify icebergs, hidden large orders that only show a small visible portion in the book while the rest fills silently.
None of this is available on TradingView, NinjaTrader's default charts, or any standard DOM. It's a different category of information.
Who Uses Bookmap and How
Bookmap works best for exchange-traded products with a transparent, accessible order book: futures (ES, NQ, CL, GC), equities through certain data feeds, and cryptocurrency through Multibook aggregation across Binance, Bybit, OKX, and other exchanges.
Day traders and scalpers are the primary users because heatmap-based trading is most actionable on intraday timeframes where liquidity dynamics play out quickly. A scalper can use Bookmap to time entries around genuine absorption rather than guessing at support and resistance from past price action. A prop firm trader can use it to identify where institutional liquidity is sitting before taking a position, sharpening both entries and stop placement.
The platform holds a 4.5 Trustpilot score from 596 reviews as of March 2026, with the most consistent praise focusing on the heatmap clarity, the quality of the educational resources, and the live daily trading sessions available to paid members at 10:30 AM EST.
The Honest Caveat: The Add-On Pricing Model
Here's the part Bookmap's own marketing doesn't lead with. Bookmap is engineered specifically as a heatmap visualization tool. Footprint charts, volume profiles, cumulative delta analysis, and advanced historical analytics are not included in the core subscription. They're available as paid add-ons, purchased separately on top of your base subscription.
For context, the Global plan at $39.99 per month covers the core heatmap, DOM, and basic order flow tools. But if you want the Iceberg Detector, Large Lot Tracker, or specific advanced indicators, each one adds cost. Competing platforms like ATAS have moved toward including equivalent tools in a single subscription at comparable pricing. The honest question for any serious trader is whether Bookmap's specific heatmap quality and the decade-plus of refinement in that one feature is worth the add-on structure versus an all-in-one alternative.
For traders who have already tried Bookmap and specifically want its heatmap, the answer is almost always yes. For first-time order flow traders deciding between platforms, the add-on model is worth mapping out against your actual planned usage before committing to the full stack.
Plans and Getting Started
Bookmap offers a free version with historical data and limited replay features. The Global plan at $39.99 per month is what serious futures traders use, covering real-time data connectivity, full DOM integration, and the core heatmap. ThinkorSwim users can access Bookmap directly within TD Ameritrade's platform at the same price, which removes the need for additional data feeds and is often the most cost-effective entry.
The free tier is genuinely useful for learning the platform and testing order flow concepts on historical data before going live. Start there, learn how to read the heatmap in replay mode, and upgrade once you know the visualization fits your trading style.
All investing and trading in securities involves risk of loss. Bookmap is a visualization tool, not a trading signal generator. Past market data displayed in any heatmap does not guarantee future results.
What Bookmap Actually Shows — and the Add-On Cost Trap to Know First
Bookmap pioneered the category. Its heatmap quality remains the benchmark that everyone else measures against. The add-on pricing model is a real trade-off to calculate before building out your full workspace. For scalpers and day traders in futures and crypto who want to see genuine real-time liquidity rather than derived indicators built on top of price, Bookmap delivers something candlestick charts fundamentally cannot. The free tier removes the risk from finding that out. Trading involves significant risk of loss and is not suitable for all investors.
“The market was always showing you where the big orders were sitting. Bookmap is the tool that finally makes those orders visible. Trading involves risk.”
The Final Word
Concluding Thoughts
Try Bookmap free to learn the heatmap on historical replay data before committing to a paid plan. The free tier is the right entry point for any trader who wants to understand order flow visualization before going live.